History suggests that investors shouldn’t be concerned about material asset return differences under different political administrations.

.
A portfolio of 60% equities and 40% fixed income has produced an annual compound return of 8.1% since 1860 with a Republican president and a 7.8% annual compound return with a Democratic president.1
Donald Trump is the winner of the 2024 United States presidential election.
Although there is clarity around the outcome of the election, some investors may feel the need to do something. While investors may be tempted to adjust their portfolios in this type of market environment, no one knows how the markets will perform in the short term, and, in many cases, timing the market for exit and then reentry simply results in selling low and buying high. What we do know is that dozens of potential factors can affect the market, making it difficult to base market strategy on a single factor such as a presidential election. In fact, Vanguard research has found no statistical relationship between asset returns in election and nonelection years.
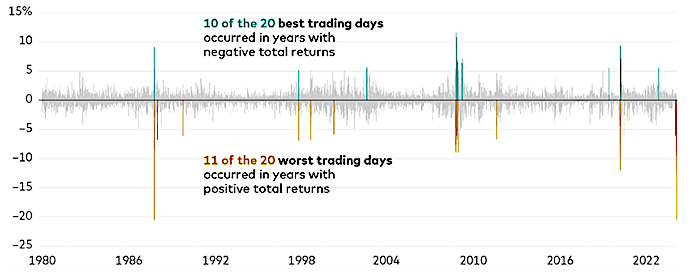
Historically, the best and worst trading days have tended to be closely timed (see chart). Investors who try to correctly time both a market exit and a return run the risk of missing out on strong performance and impairing their long-term investment success.
Timing the market is futile: The best and worst trading days happen close together


Sources: Vanguard calculations as of December 31, 2023, based on data from Refinitiv using the Standard & Poor’s 500 Price Index.
Notes: Past performance is no guarantee of future returns. The performance of an index is not an exact representation of any particular investment, as you cannot invest directly in an index.
The success of financial markets over the long term is not driven by short-term events, but rather by economic growth, interest rates, productivity, innovation, and dozens of other variables.
Focus on what you can control
We believe that investors are well-served by our Principles for Investing Success: Have clear, appropriate investment goals; keep a balanced and diversified mix of investments; minimise costs; and maintain perspective and long-term discipline. These principles are timeless—and especially useful in times such as these.
The bottom line: Stick to your long-term investment strategy.
Notes
1 Vanguard's calculations are based on data from Global Financial Data (GFD) as of December 31, 2023. The 60% GFD US-100 Index and 40% GFD US Bond Index portfolio return is calculated by GFD. The GFD US-100 Index includes the top 25 companies by capitalisation from 1825 to 1850, the top 50 companies from 1850 to 1900, and the top 100 companies from 1900 to the present. In January of each year, the largest companies in the United States are ranked by capitalization, and the largest of those companies are chosen to be part of the index for that year. The next year, a new list is created and chain-linked to the previous year’s index. The index is capitalisation-weighted, and both price and return indexes are calculated. The GFD US Bond Index uses the U.S. government bond closest to a 10-year maturity without exceeding 10 years from 1786 until 1941 and the Federal Reserve’s 10-year constant maturity yield beginning in 1941. Each month, changes in the price of the underlying bond are calculated to determine any capital gain or loss. The index assumes a laddered portfolio that pays interest monthly. Past performance is no guarantee of future returns. The performance of an index is not an exact representation of any particular investment, as you cannot invest directly in an index.
All investing is subject to risk, including possible loss of principal. Be aware that fluctuations in the financial markets and other factors may cause declines in the value of your account. There is no guarantee that any particular asset allocation or mix of funds will meet your investment objectives or provide you with a given level of income.
Diversification does not ensure a profit or protect against a loss.
Investments in bonds are subject to interest rate, credit, and inflation risk.
Disclaimer
Vanguard Investments Australia Ltd (ABN 72 072 881 086 / AFS Licence 227263) is the product issuer and the Operator of Vanguard Personal Investor. We have not taken your objectives, financial situation or needs into account when preparing this material so it may not be applicable to the particular situation you are considering. You should consider your objectives, financial situation or needs, and the product disclosure documents for any financial product we make available before making any investment decision. Before you make any financial decision regarding Vanguard financial products, you should seek professional advice from a suitably qualified adviser. A copy of the Target Market Determinations (TMD) for Vanguard's financial products can be obtained at vanguard.com.au free of charge and include a description of who the financial product is appropriate for. You should refer to the TMD before making any investment decisions. You can access our IDPS Guide, PDSs Prospectus and TMD at vanguard.com.au or by calling 1300 655 101. Past performance information is given for illustrative purposes only and should not be relied upon as, and is not, an indication of future performance. This material was prepared in good faith and we accept no liability for any errors or omissions..
© 2024 Vanguard Investments Australia Ltd. All rights reserved.
